Source Data: Superstore Sales
Aim: Create a rounded bar chart of sales in each state.
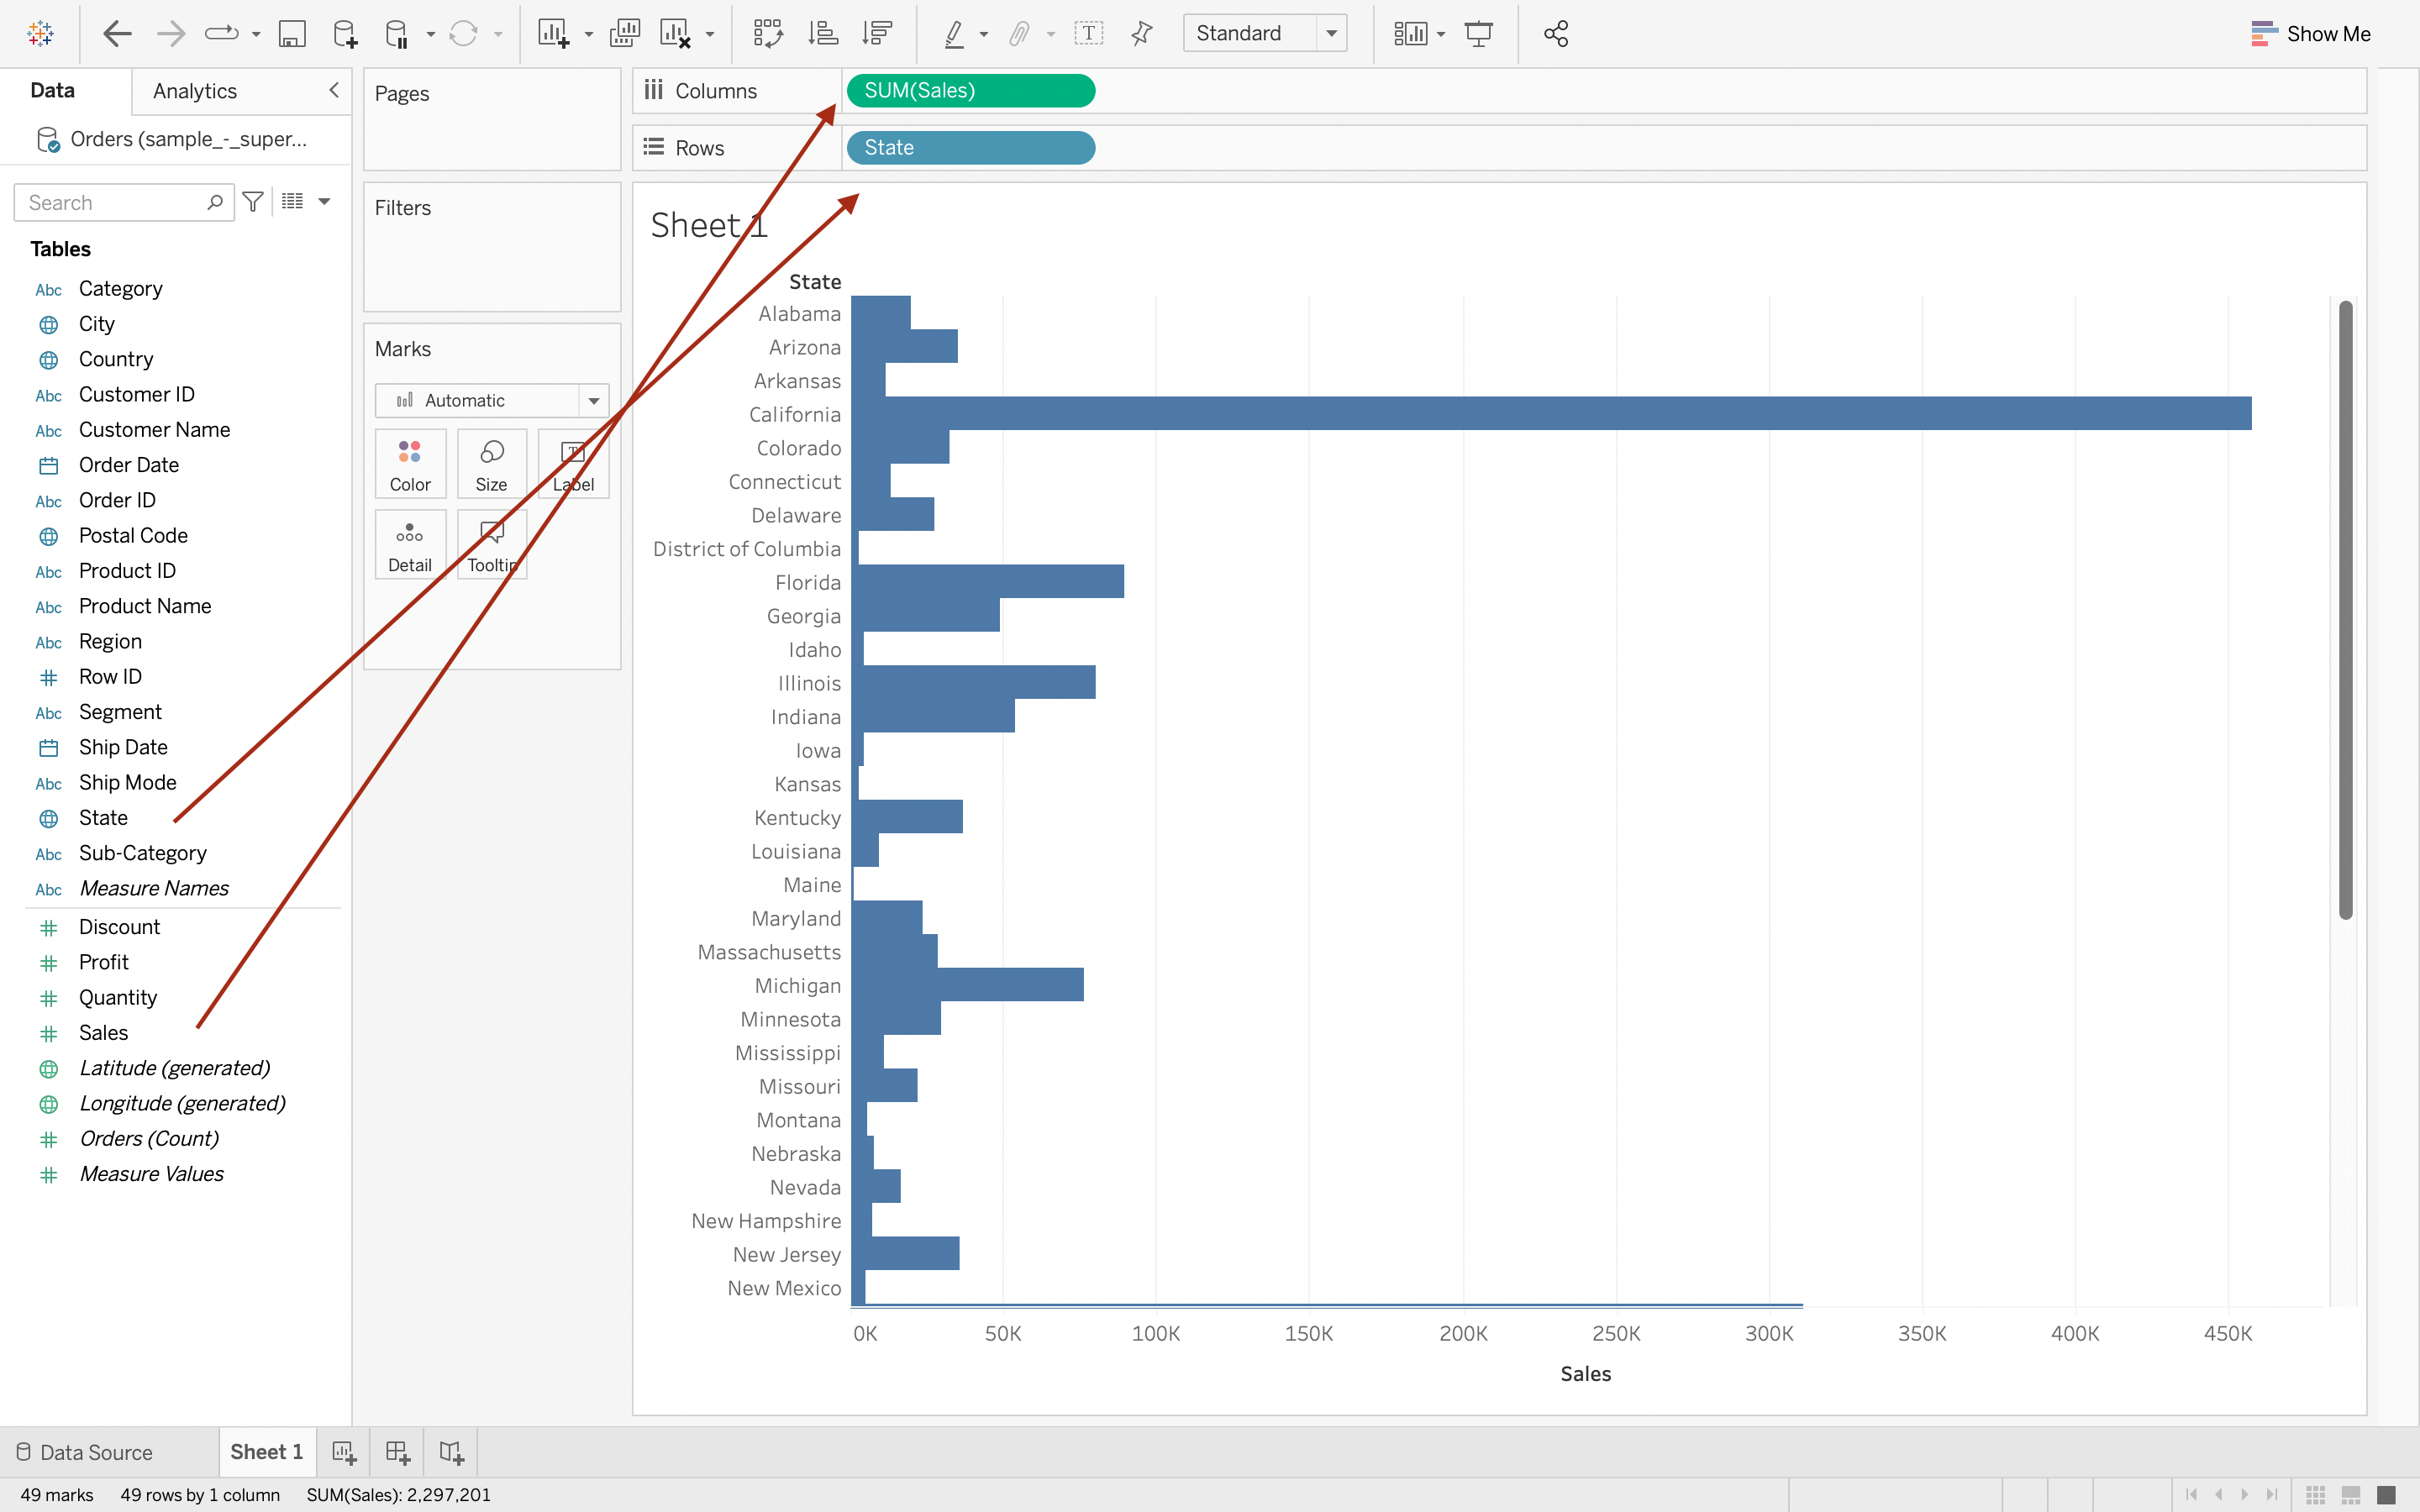
Step 1
Drop State & Sales from data pane to Rows & Columns respectively.
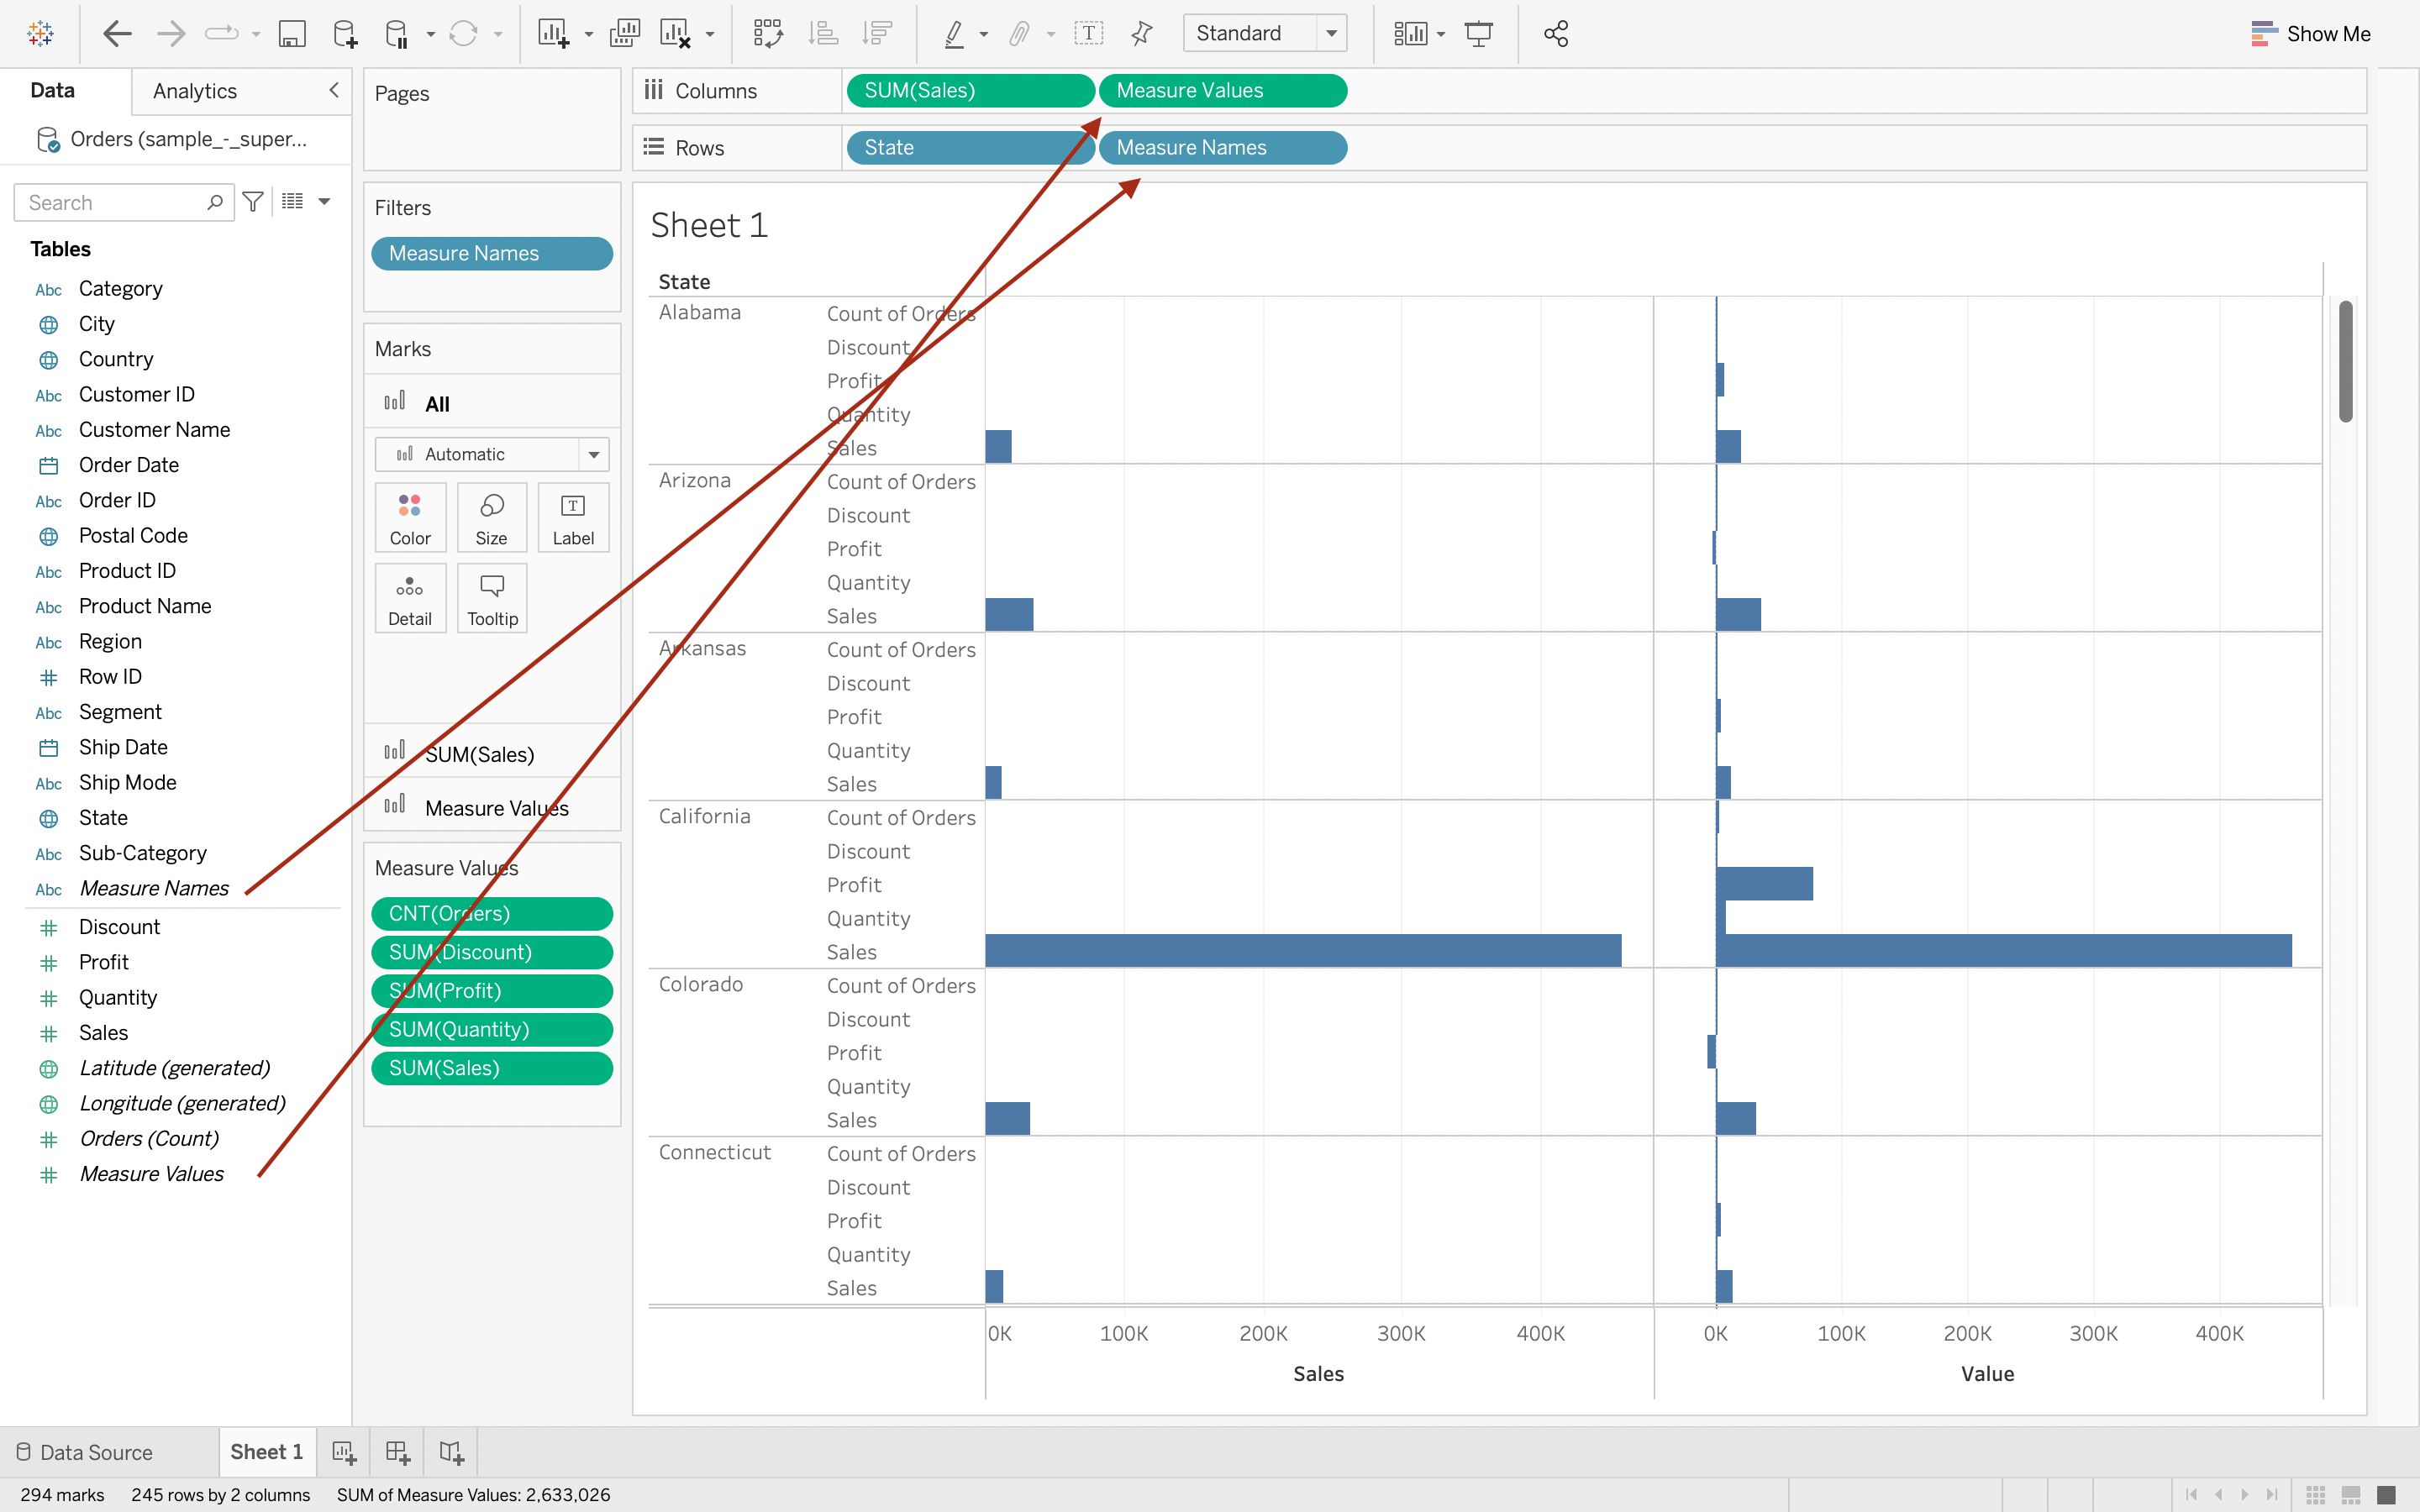
Step 2
Drop Measure Names & Measure Values from data pane to Rows & Columns respectively.
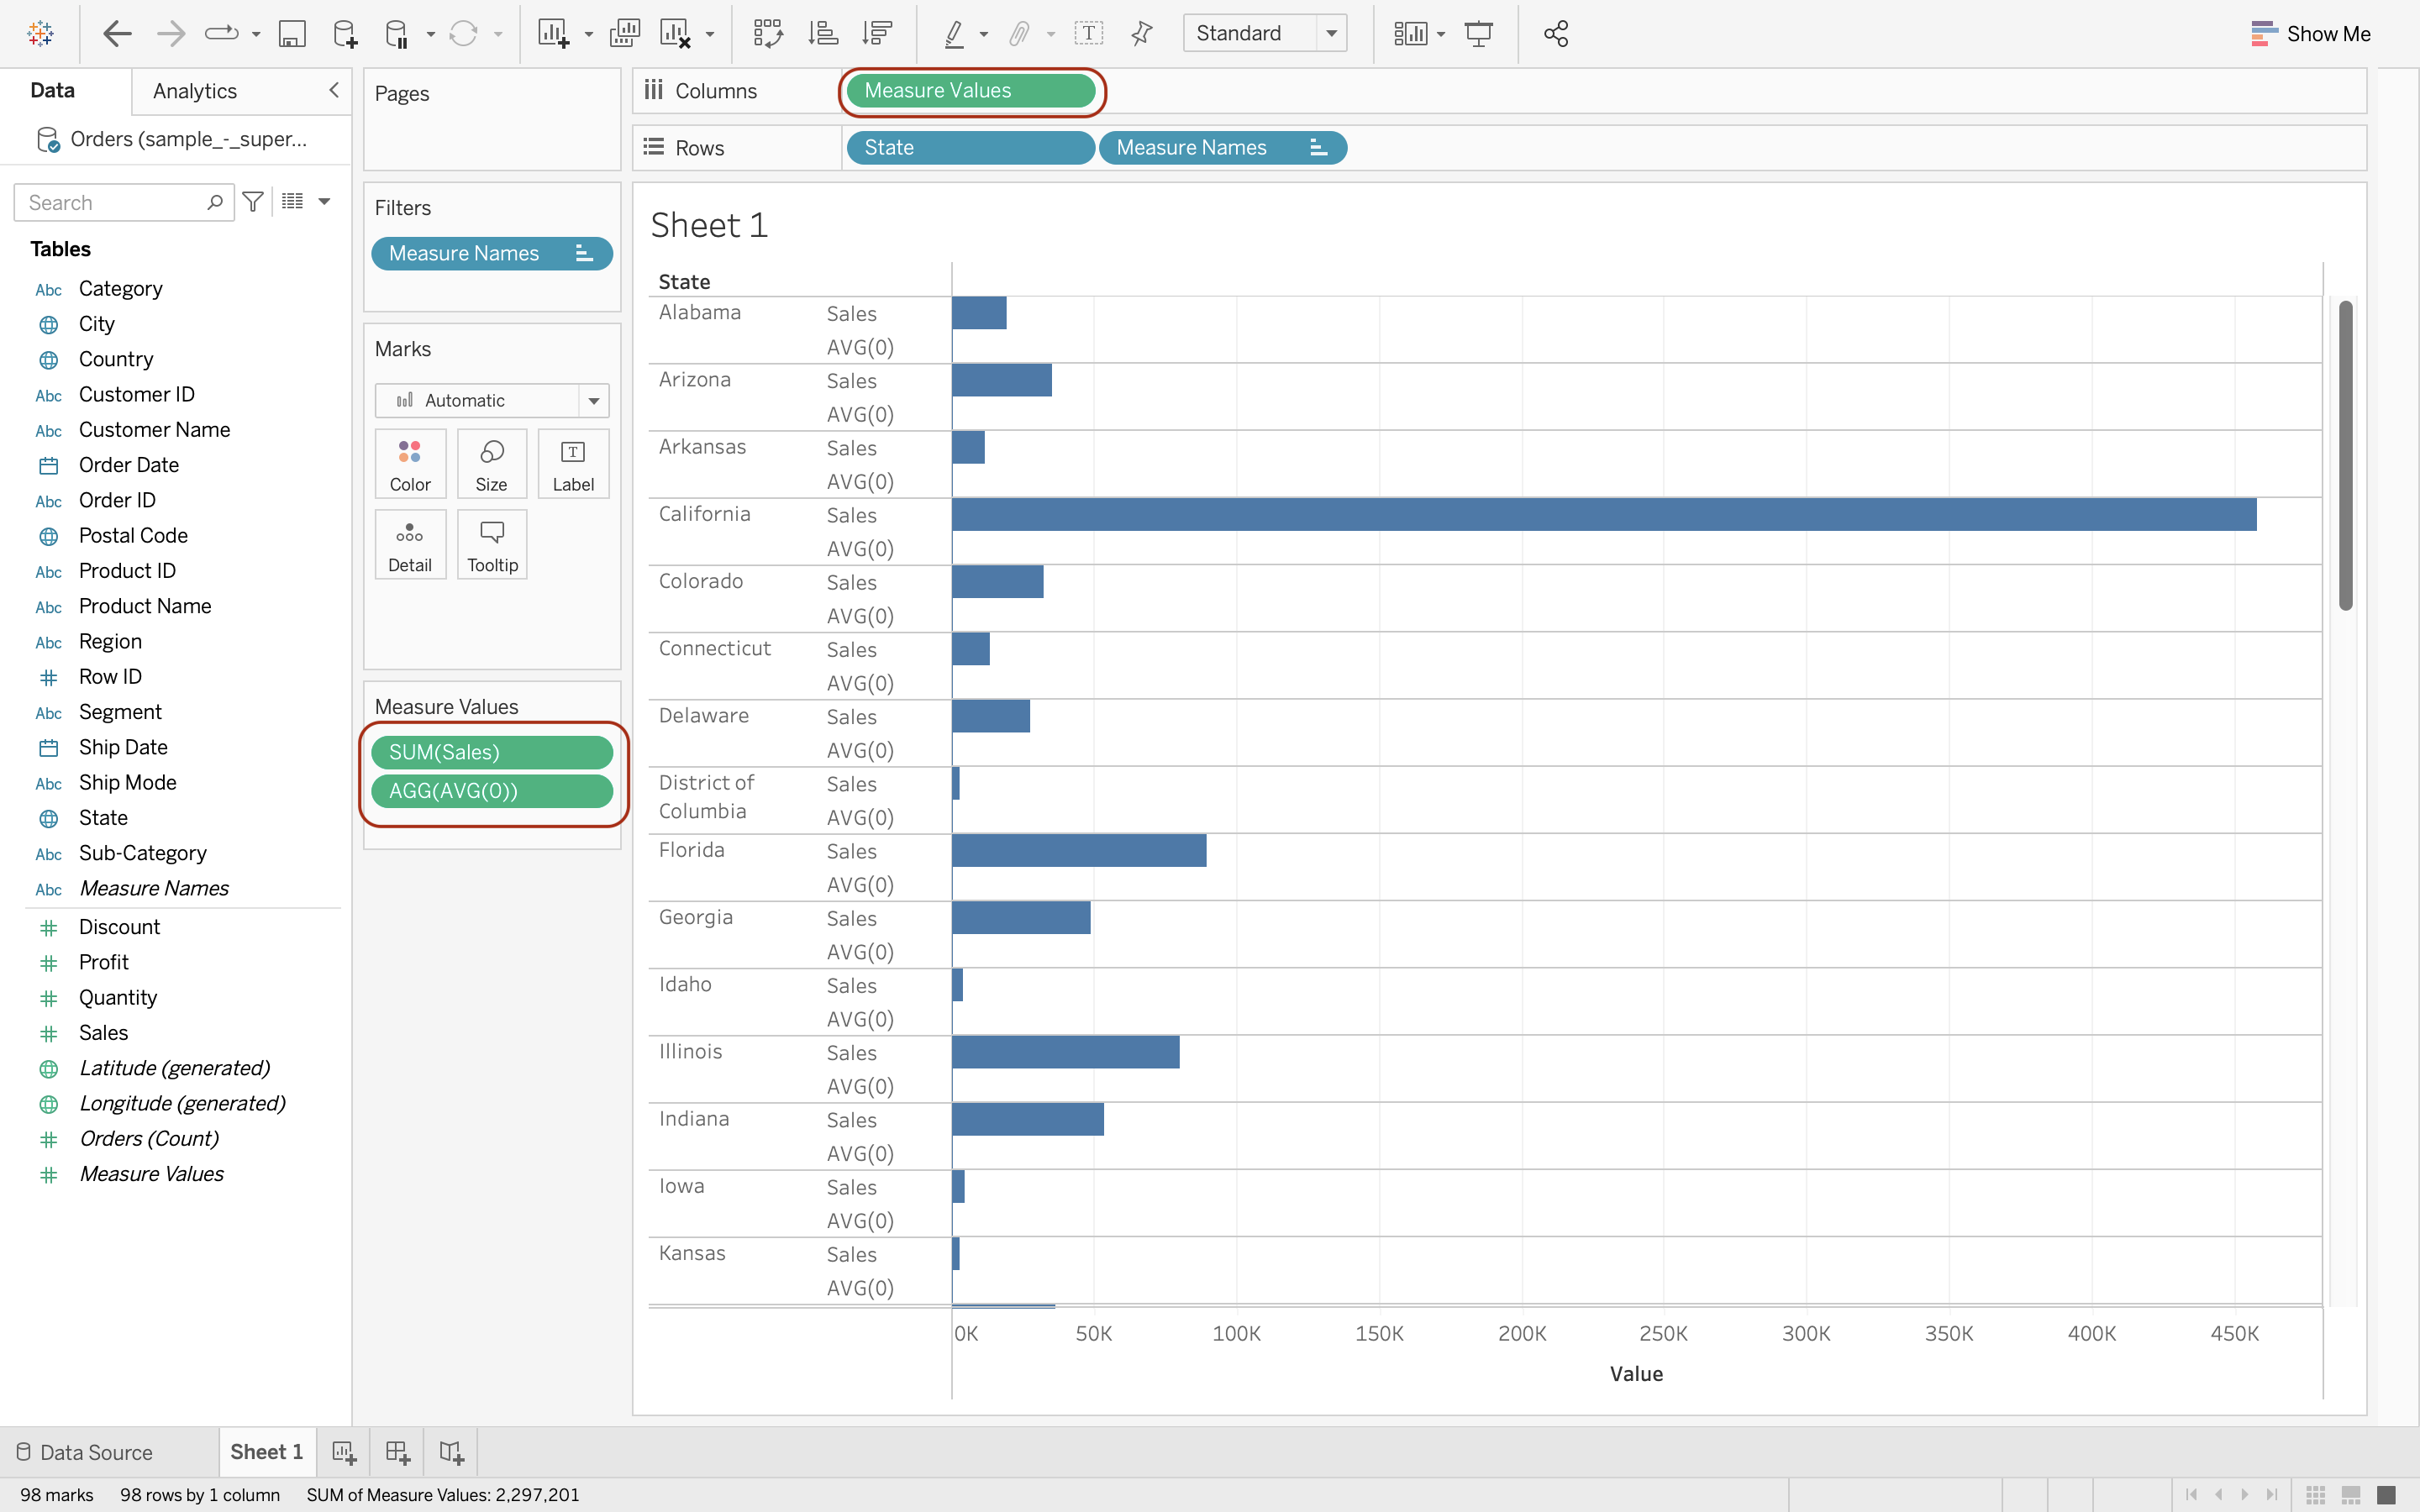
Step 3
Remove unrelavant items in "Measures Values" Card and "SUM(Sales)" in Columns. Double click in "Measures Values" Card and type in "AVG(0)"
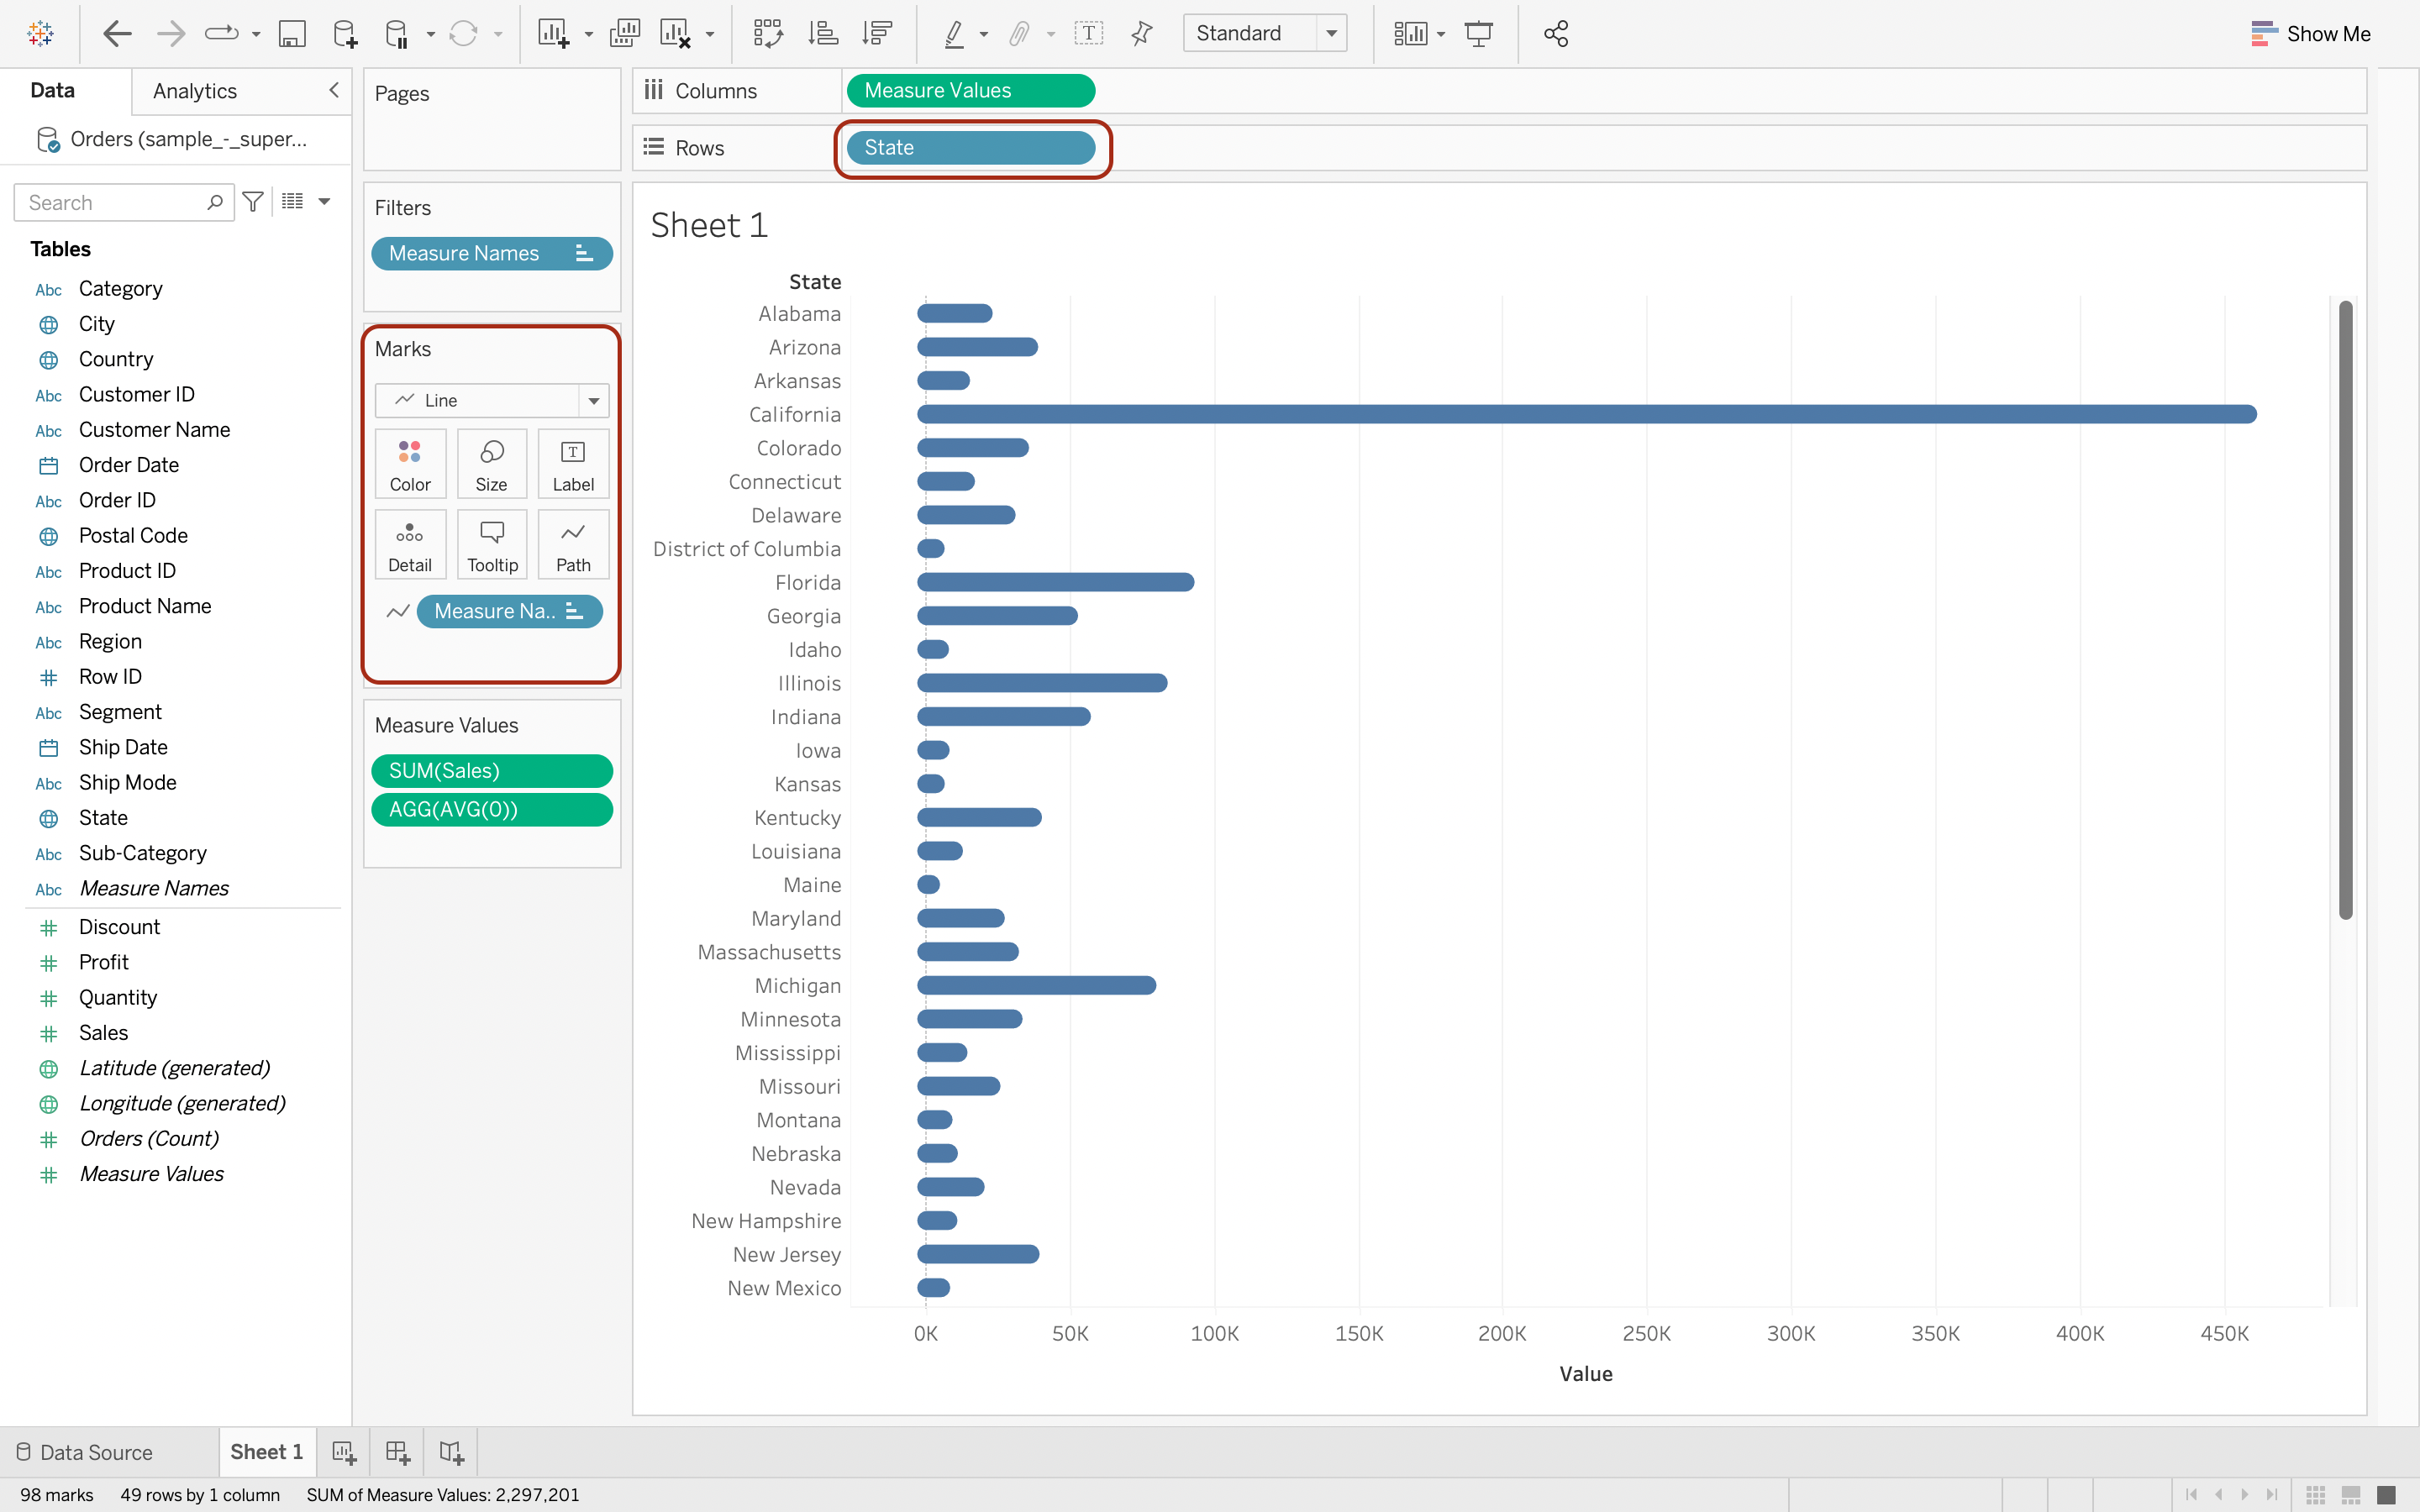
Step 4
Change "Marks" card from automatic to line and Drop "Measure Names" in Rows over to "Path".