Source Data: Superstore Sales
Aim: Create a bar-in-bar chart of sales of ship modes in 2016 & 2017.
Step 1
Create calculated fields of sales in 2016 & 2017
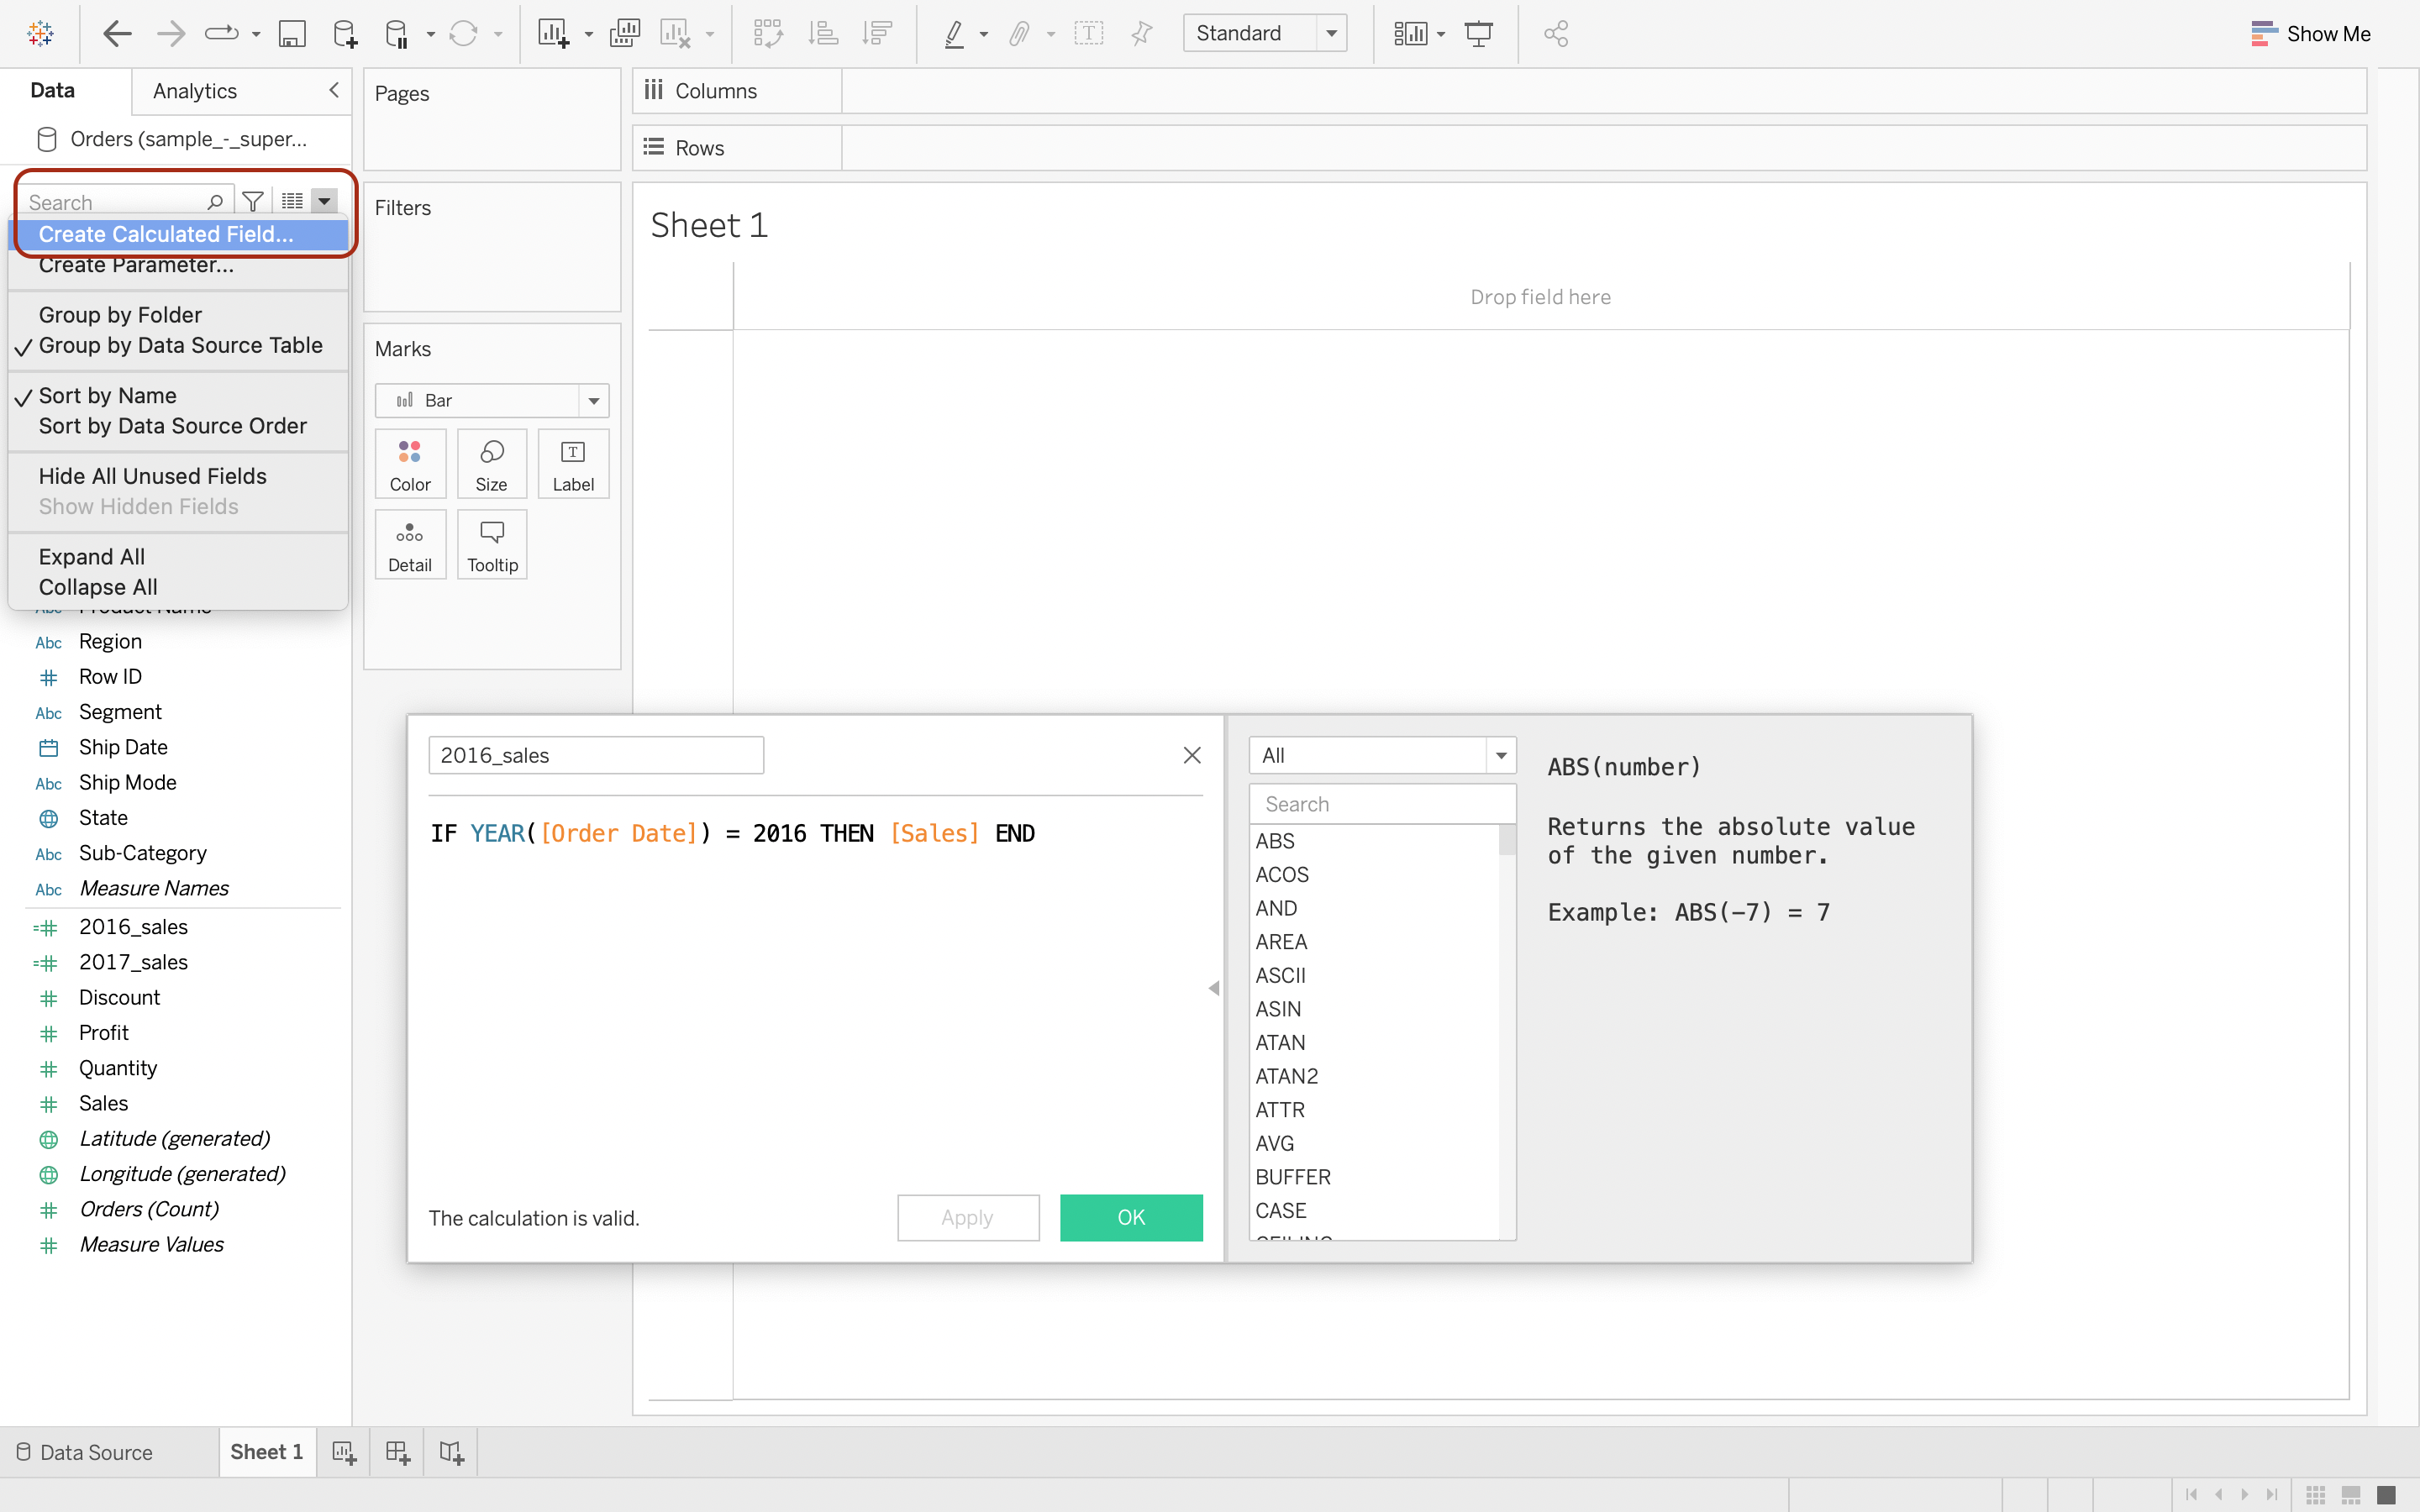
The syntax for sales_2016:
IF YEAR([Order Date]) = 2016 THEN [Sales] END
The syntax for sales_2017:
IF YEAR([Order Date]) = 2017 THEN [Sales] END
Step 2
Drop "Ship Mode" to Rows and "2016_sales" to Columns. And then drop "2017_sales" to the axis of "2016_sales".
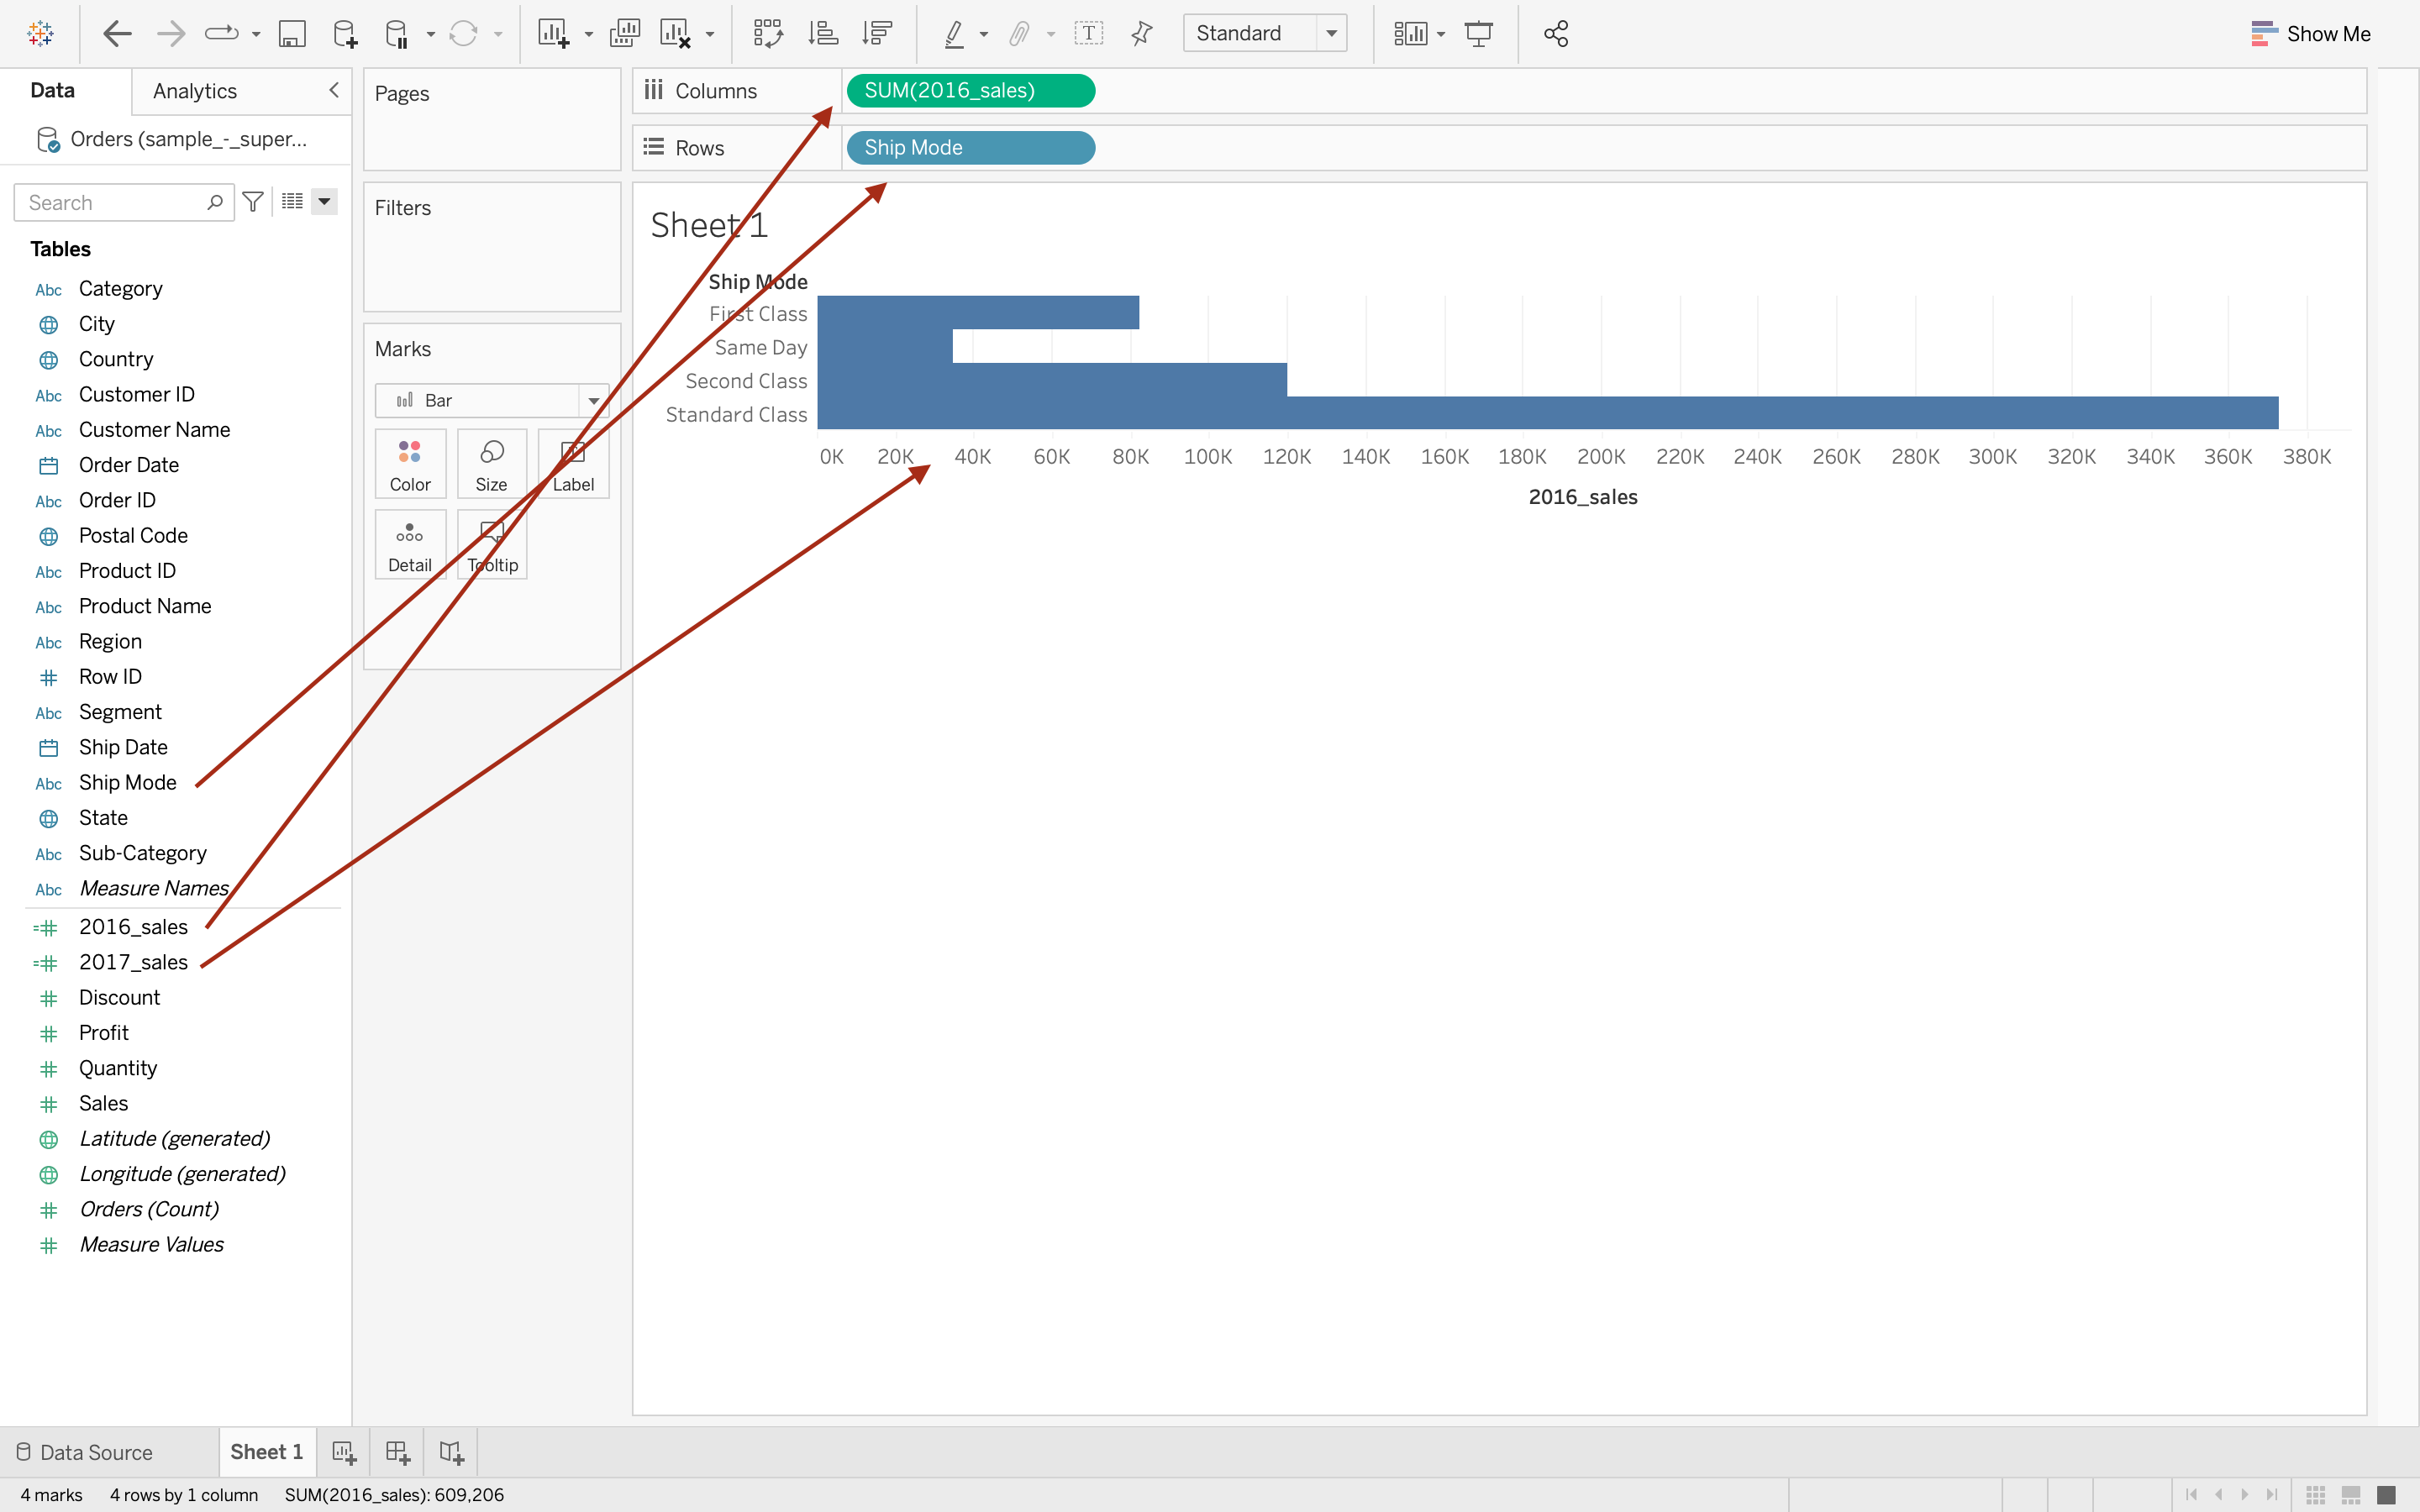
The chart would be like this:
Step 3
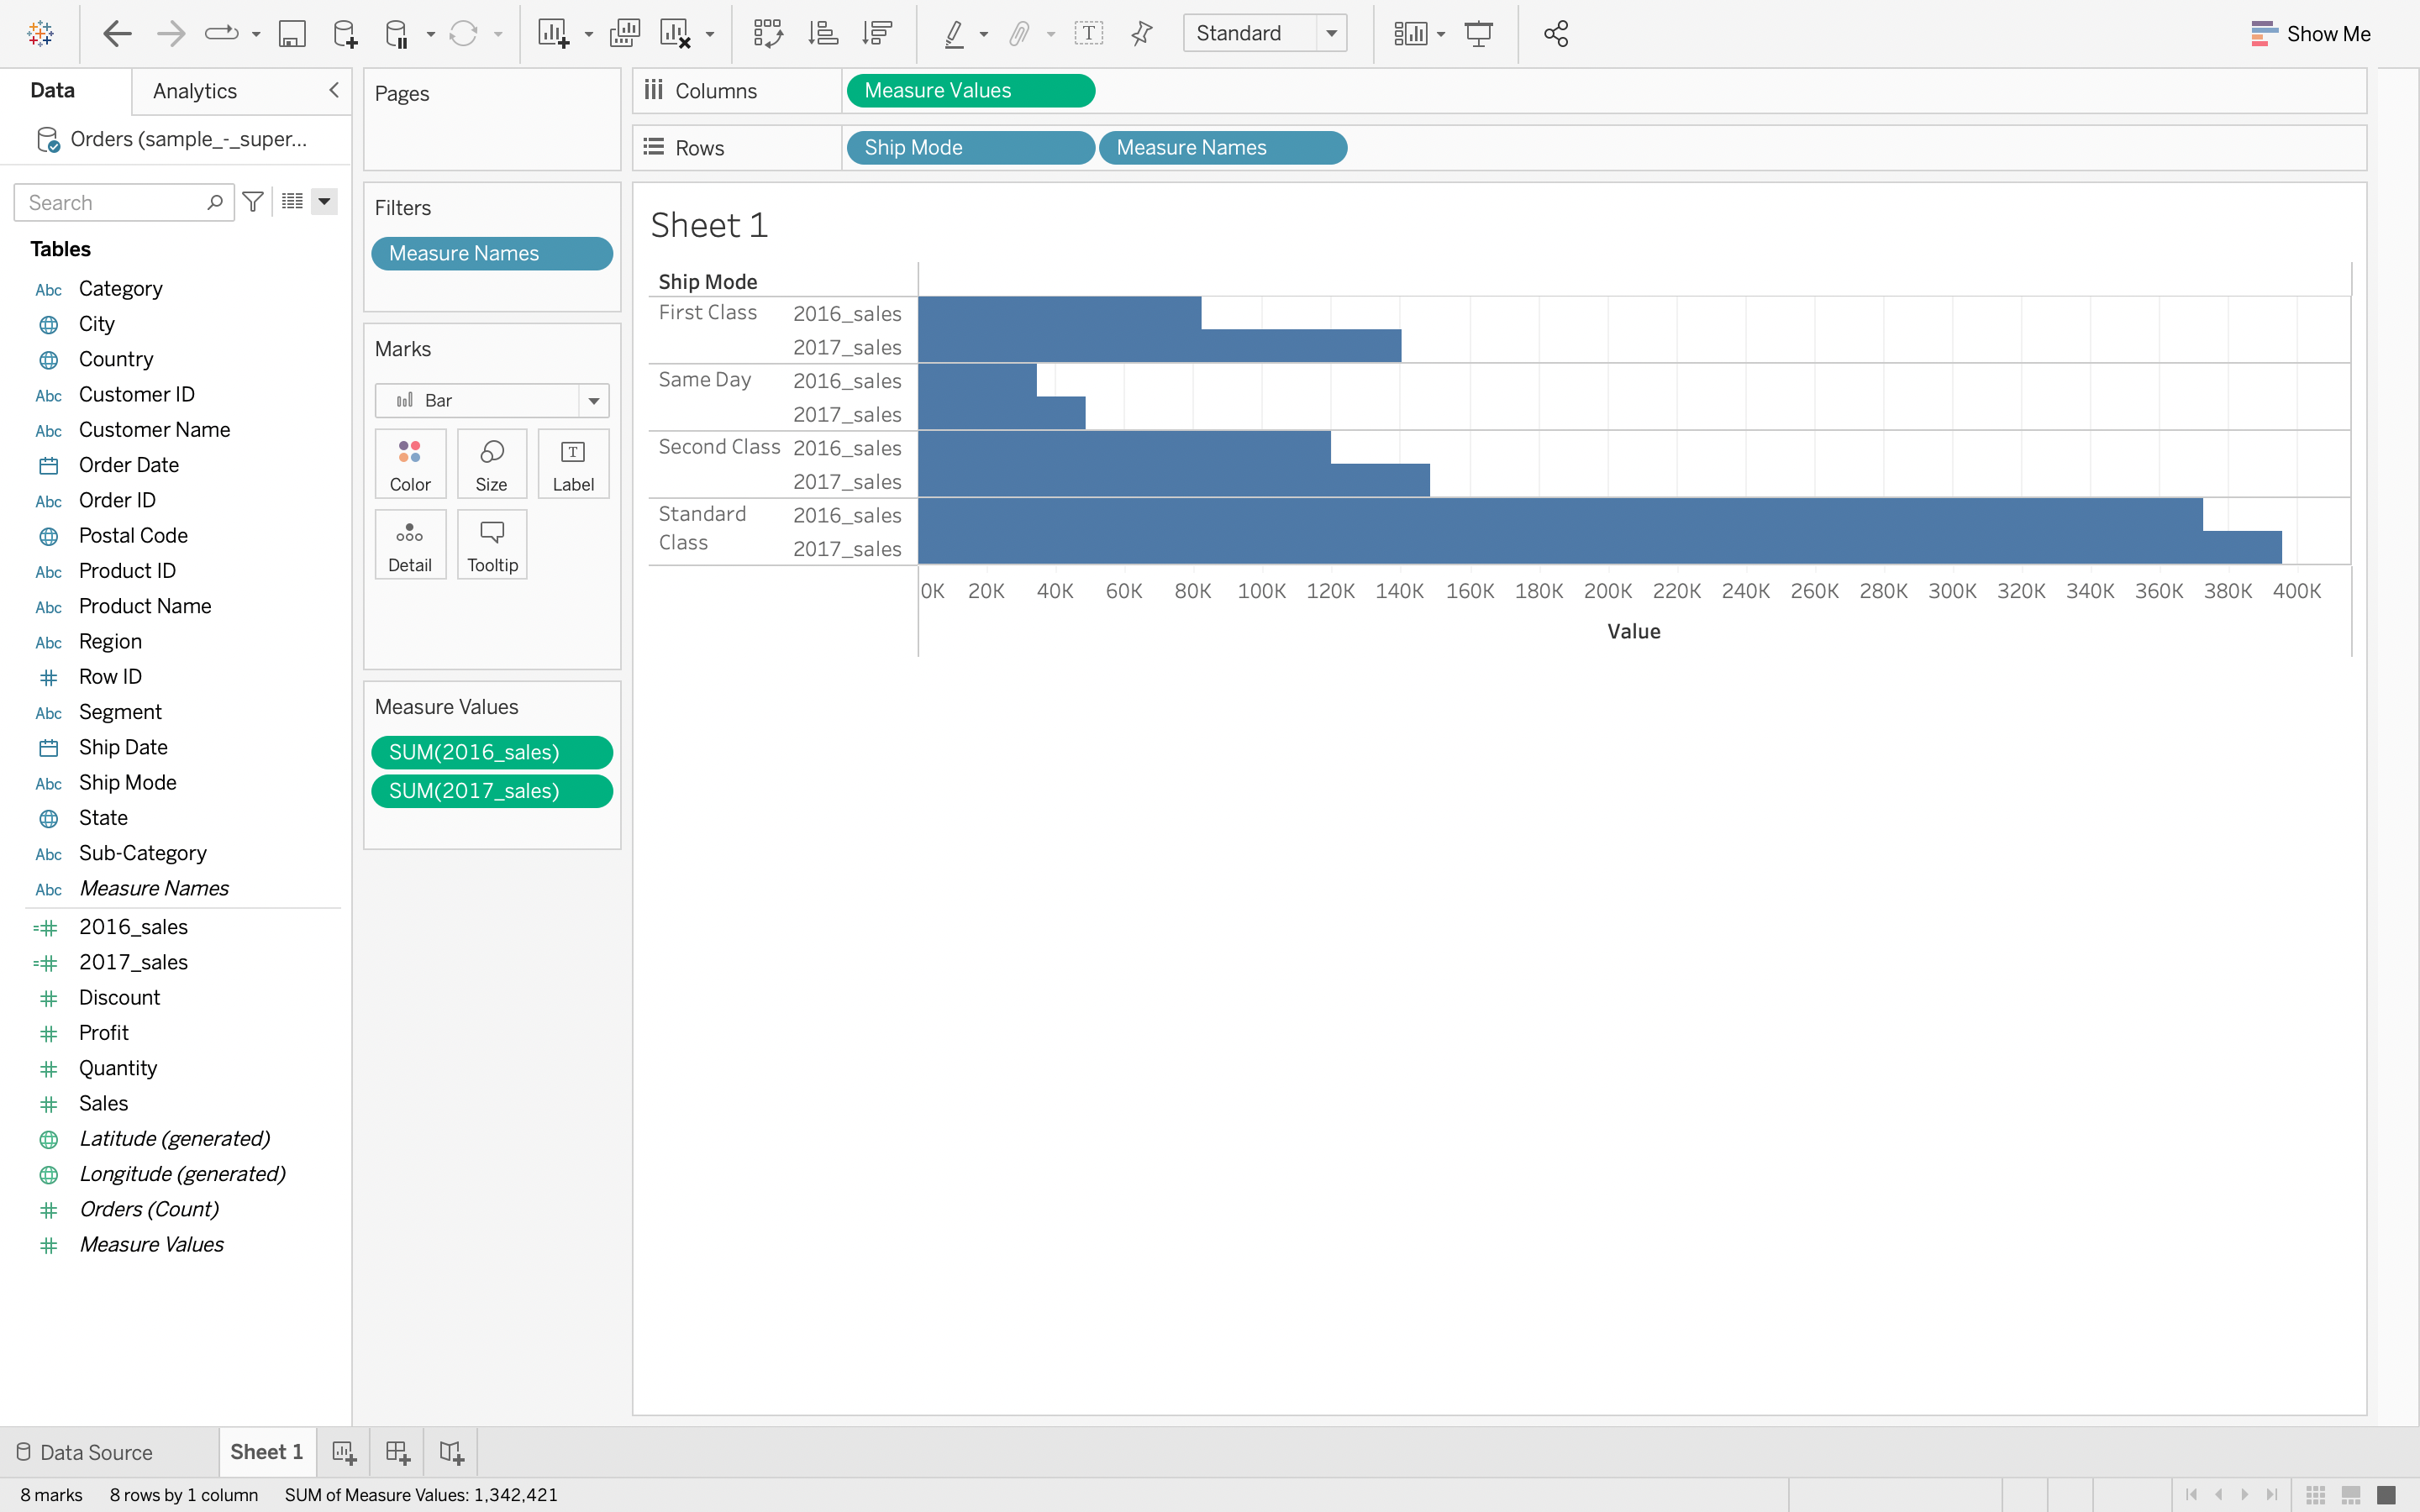
Dops "Measure Names" in Rows to "Color" and that in data pane to "Size" in "Marks" Card.
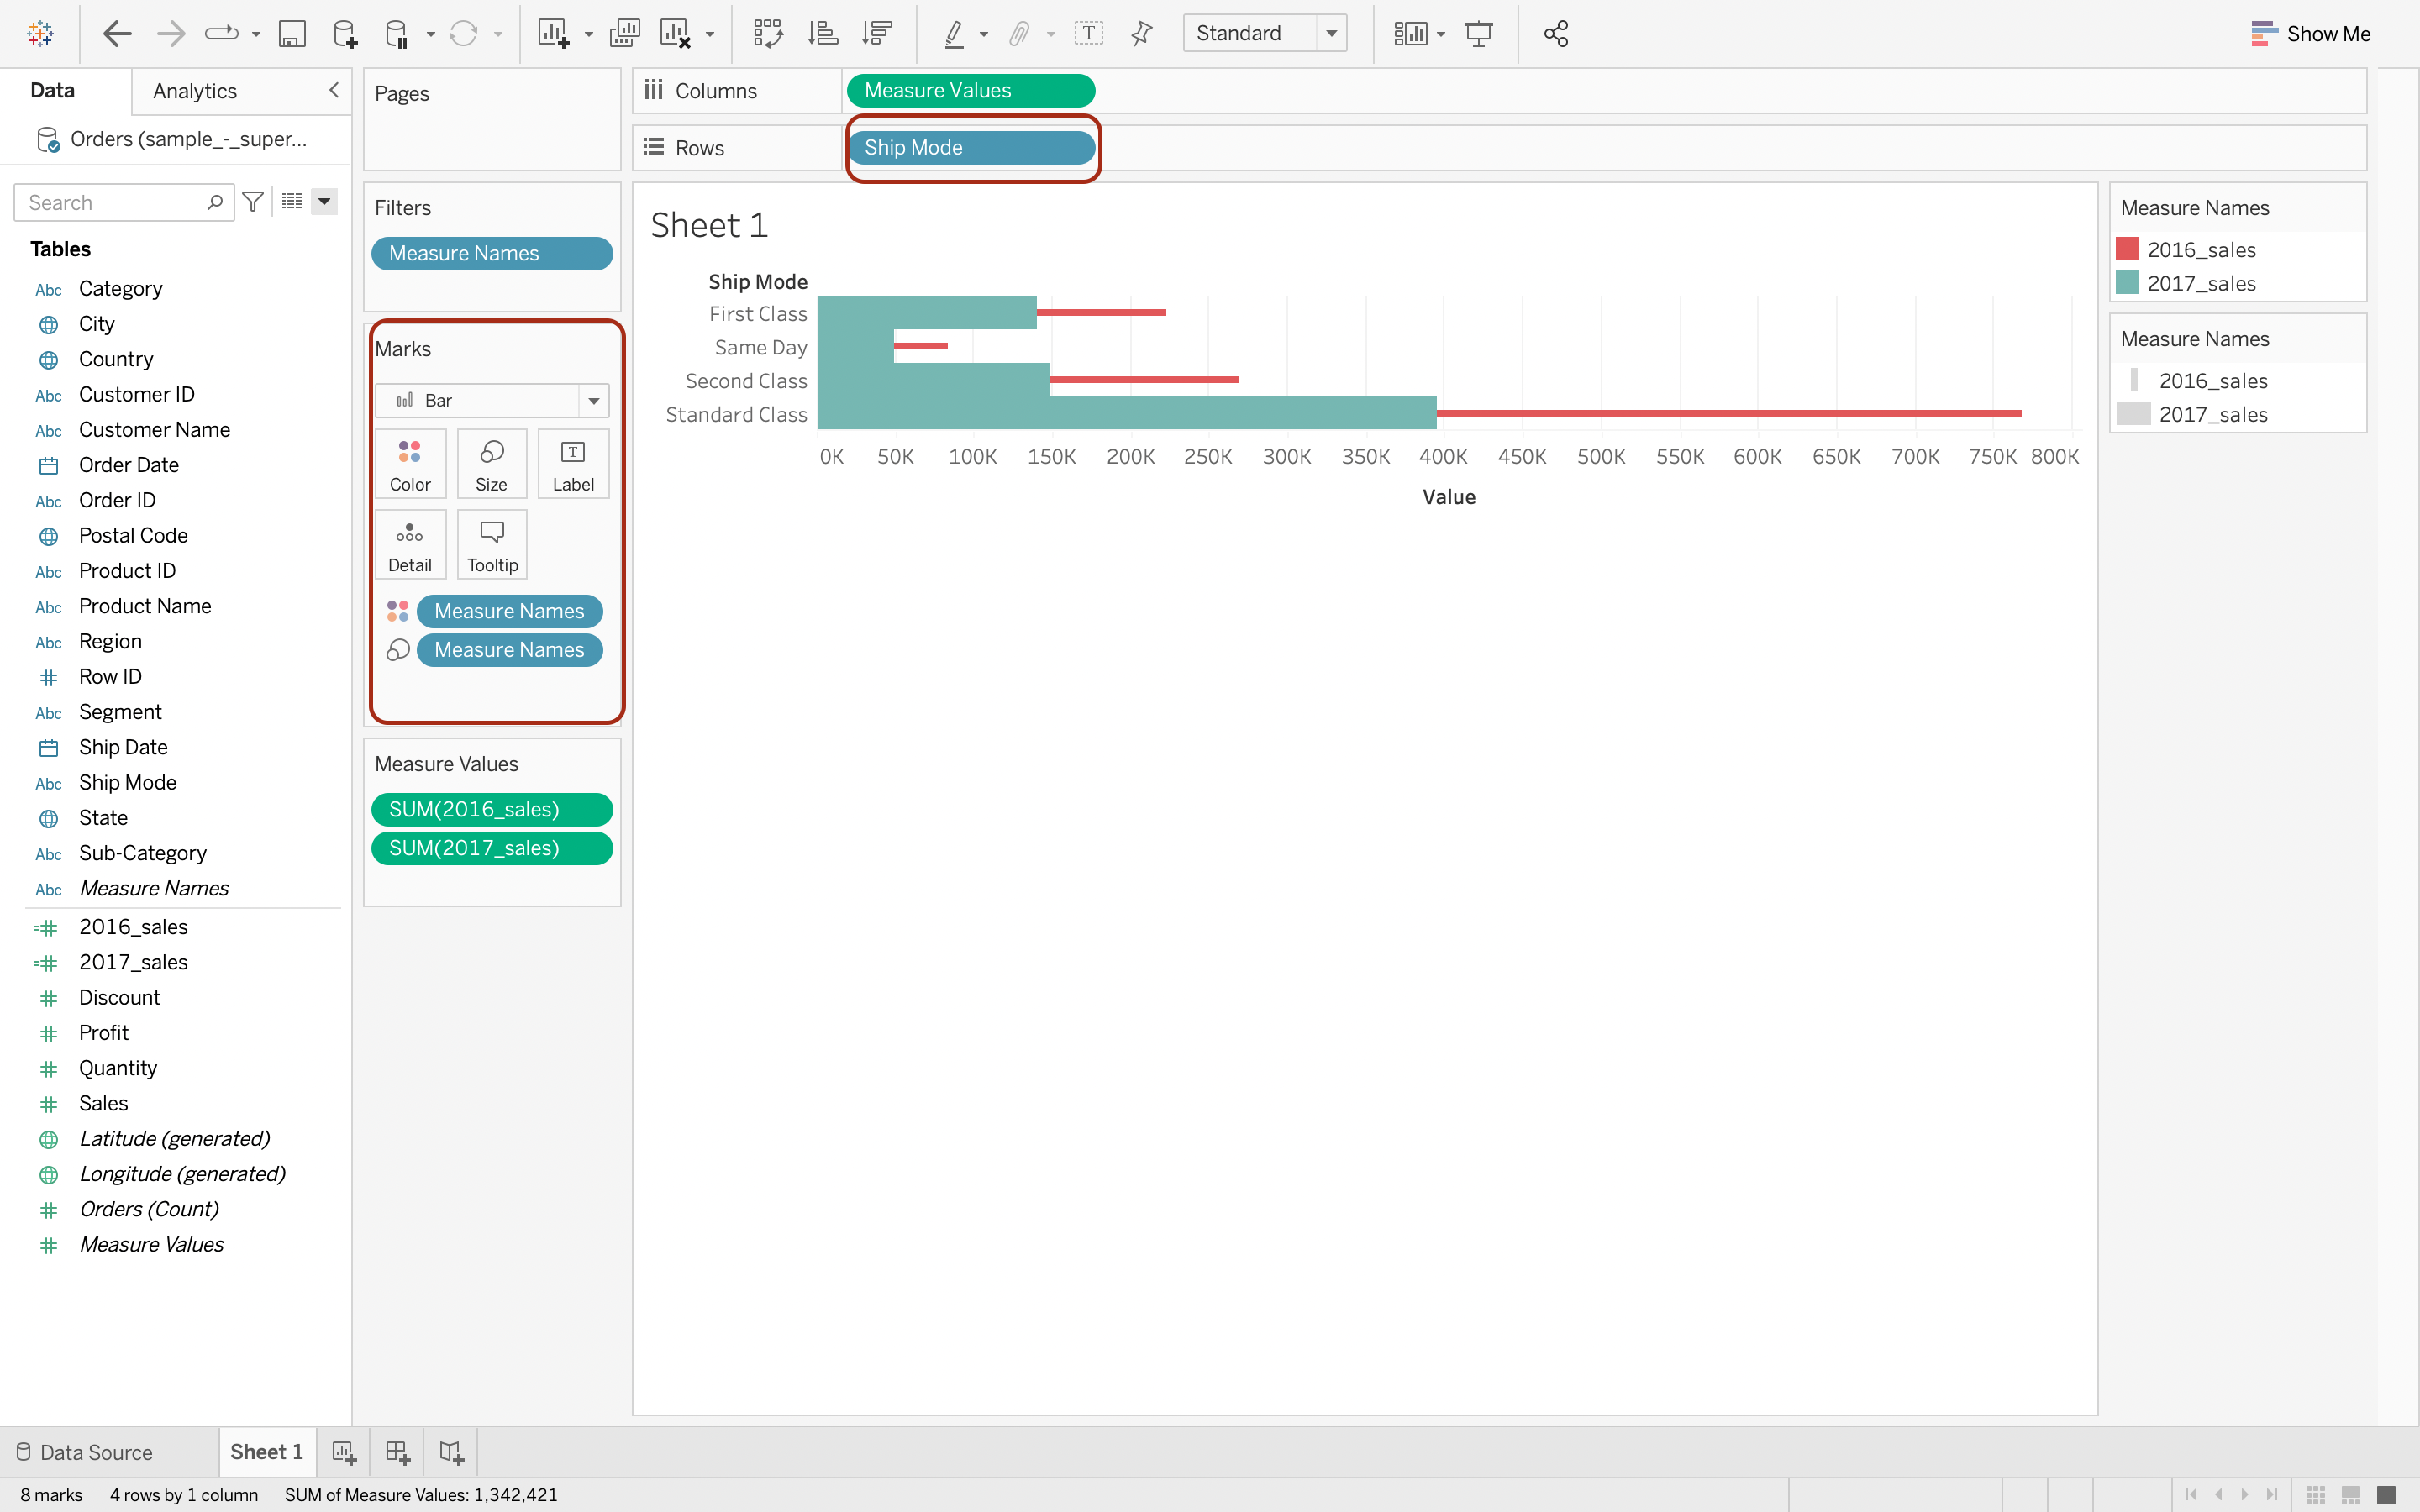
Step 4
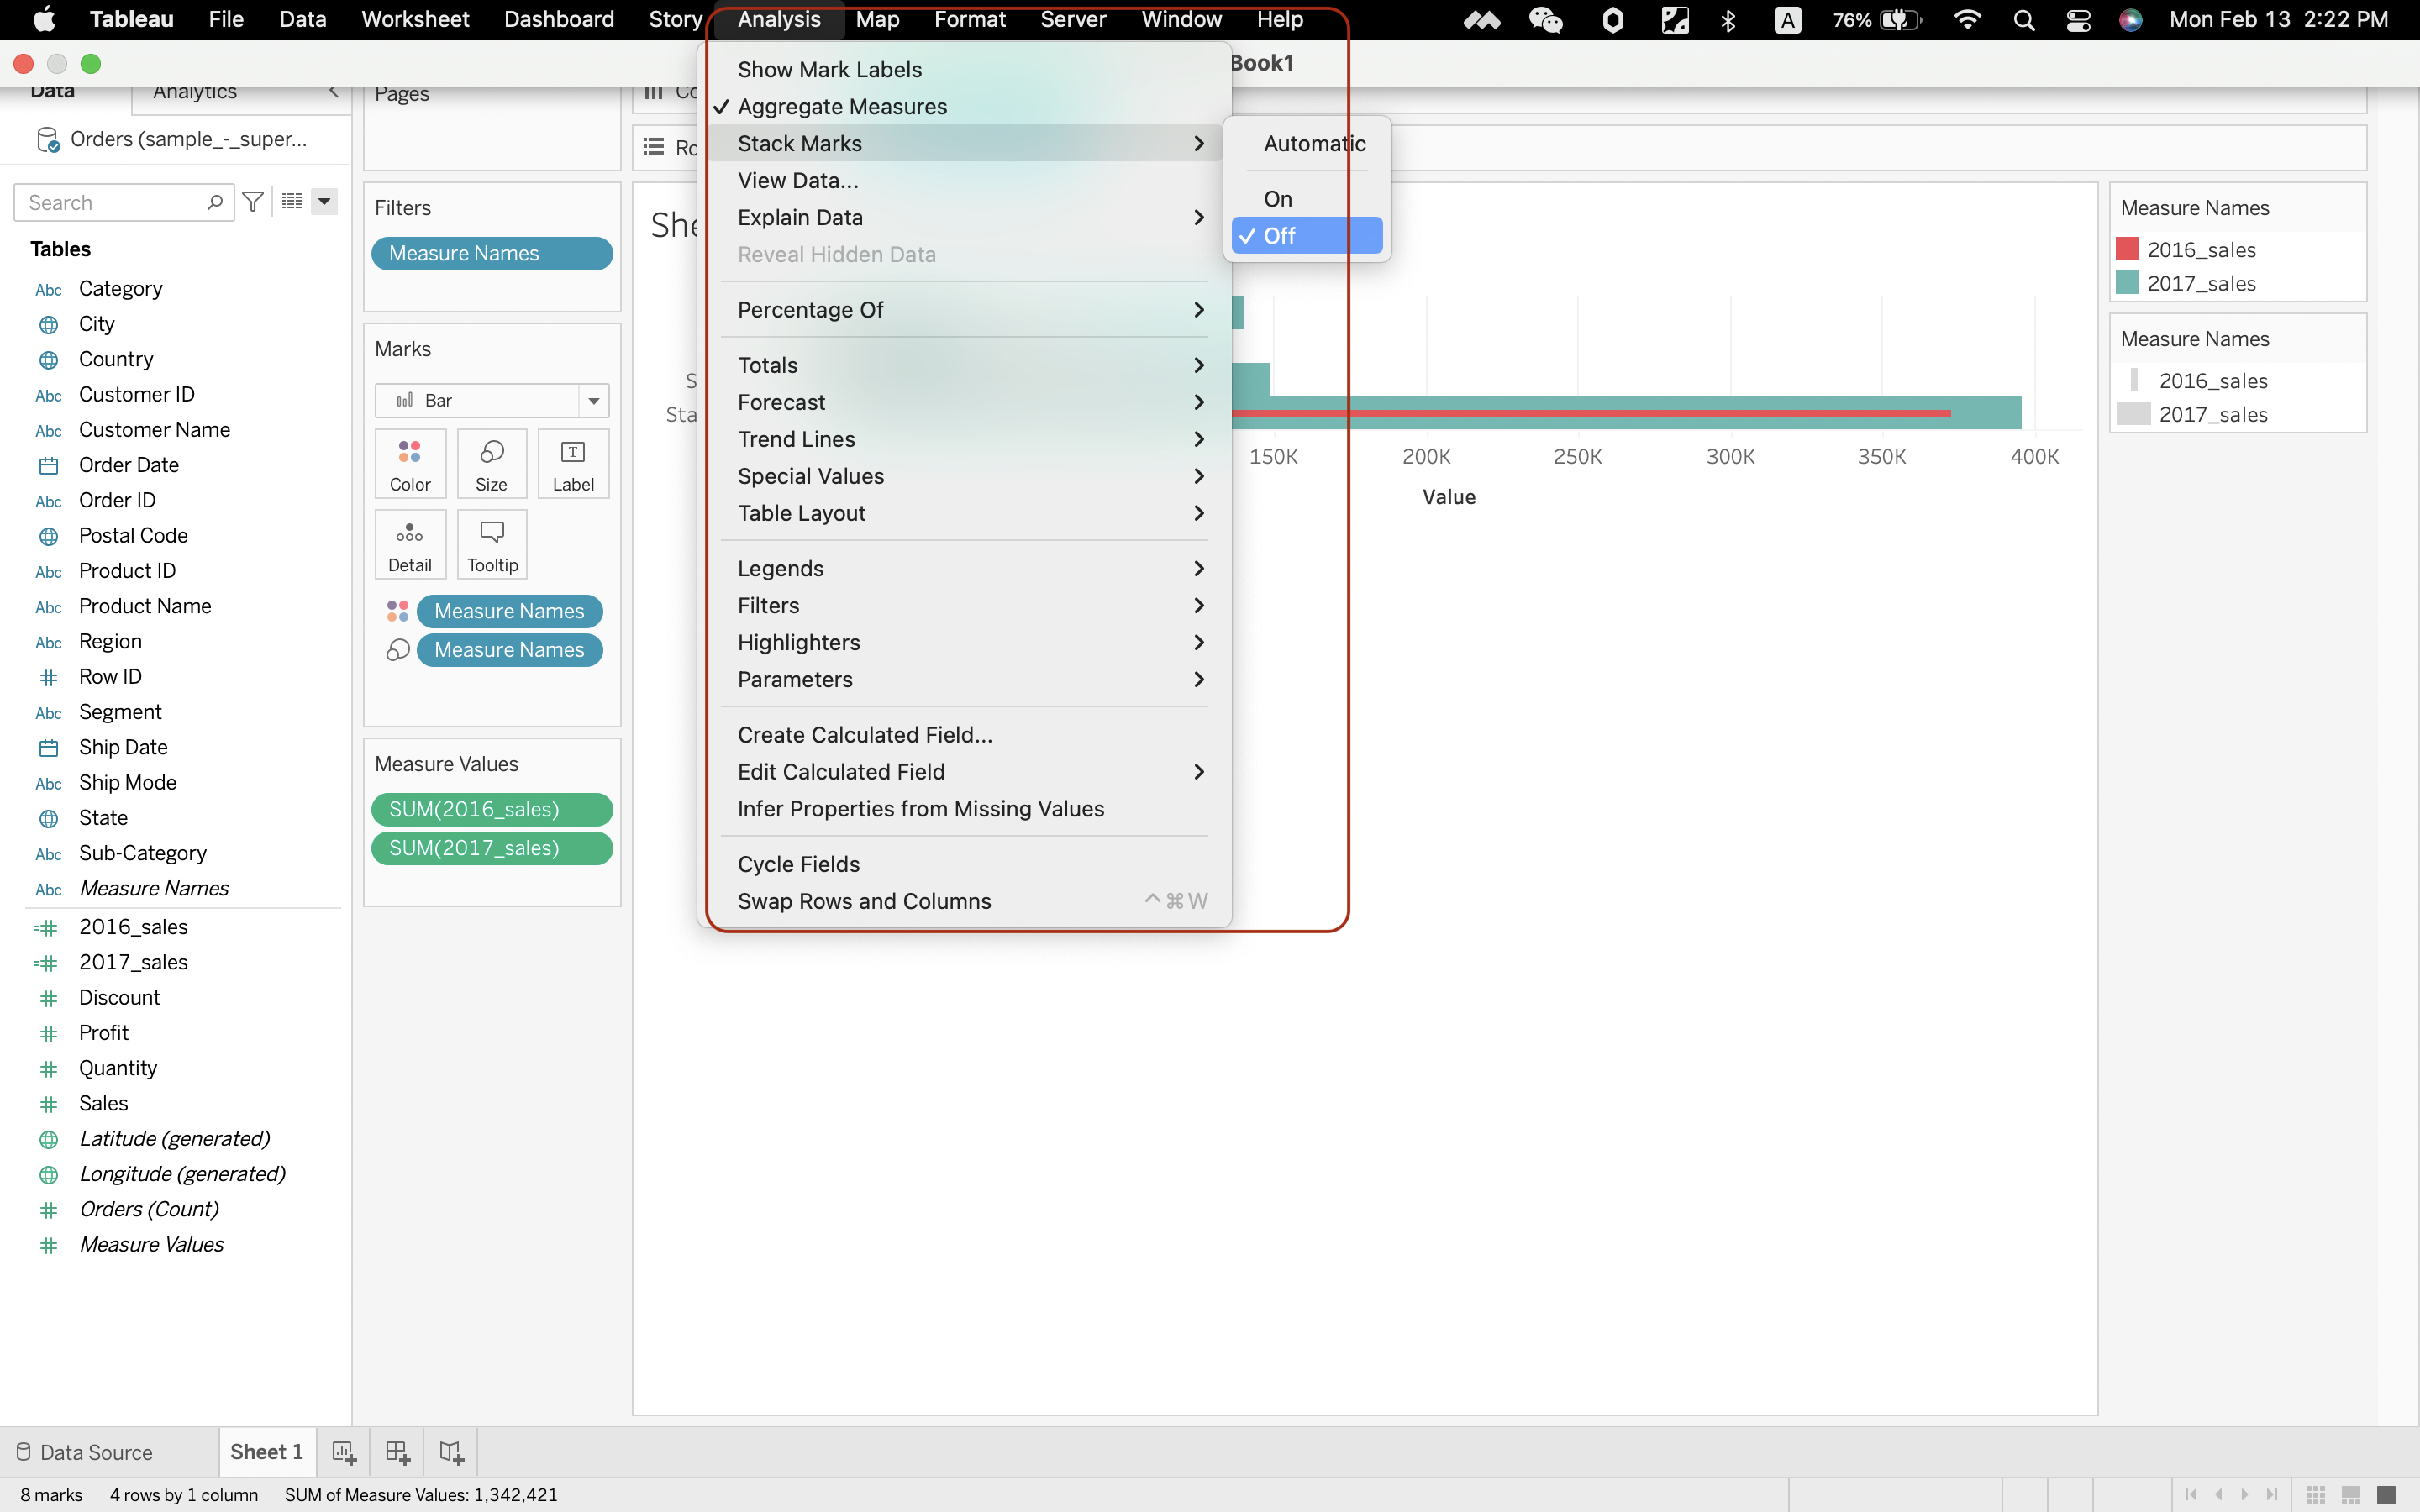
Turn off stack marks in analysis.